Real functions of a real variable
Part 2 · Functions · Chapter 2 · lecture notes by Fabio Furini · Chapter PDF
1. Real function of a real variable
Definition 1: real function of a real variable
A function whose domain \(D\) is a subset of \(\mathbb{R}\) and whose codomain is \(\mathbb{R}\):
is called a real function of a real variable.
-
These are functions in which the “input” variable \(x\) and the “output” variable \(f(x)\) are real numbers.
-
The most common real functions of a real variable have as domain \(D\) and as image \(f(D)\) an interval (possibly the whole of \(\mathbb{R}\)) or the union of a finite number of intervals.
The dependence of the output \(f(x)\) on the input \(x\) is effectively visualized by drawing the graph of \(f\), that is, the set of points of the plane with coordinates \((x,y)\) such that \(y = f(x)\) and \(x\) in the domain \(D\).
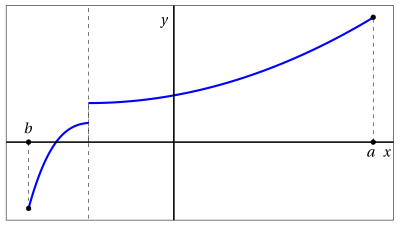
Example of the graph of a real function of a real variable with domain \(D = [a, b]\) (a closed and bounded interval):
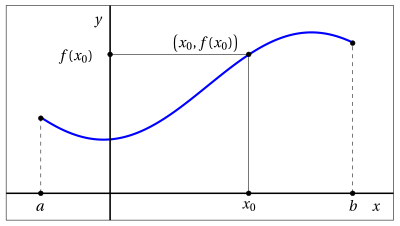
Every line parallel to the \(y\)-axis that intersects the \(x\)-axis at a point \(x_0\) of the domain \(D\) intersects the graph of \(f\) at one and only one point. 1 Therefore, not all curves are graphs of functions.
Note, instead, that nothing prevents a line parallel to the \(x\)-axis from intersecting the graph of \(f\) at several points or at no point at all.
Example 1: curve that does not correspond to the graph of a function
Consider, for example, the curve made of the points of the circle of radius \(r\):
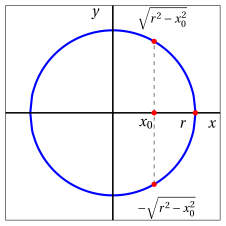
It is not possible to associate a unique output with the input \(x_0 \in (-r,r)\), hence this curve does not correspond to the graph of a function!
2. Bounded functions
!!! definizione "Definition 2: bounded functions"
Given a function $f: D \subseteq \mathbb{R} \rightarrow \mathbb{R}$, the function is said to be

$$
\begin{cases}
{\rm bounded~above} & {\rm if~~} \exists M \in \R: f(x) \le M,~~ \forall  x \in D\\[2ex]
{\rm bounded~below} & {\rm if~~} \exists M \in \R: f(x) \ge M,~~ \forall  x \in D\\[2ex]
{\rm bounded} & {\rm if~~} \exists M \in \R_{\ge 0}: |f(x)| \le M,~~ \forall  x \in D\\
\end{cases}
$$
-
Graphically, we have:
-
a function is bounded above if its graph is contained in the lower half-plane bounded by a line parallel to the \(x\)-axis
-
a function is bounded below if its graph is contained in the upper half-plane bounded by a line parallel to the \(x\)-axis
-
a function is bounded if its graph is contained in a horizontal strip
-
Example 2: bounded function
Consider the function:
we have
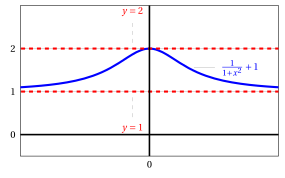
Example 3: Unbounded function
The function
is bounded neither above nor below.
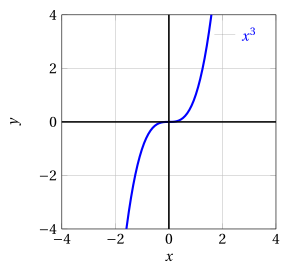
Example 4: Function bounded below
The function
is bounded below; indeed, \(x^2 \ge 0, \forall x \in \mathbb{R}\)
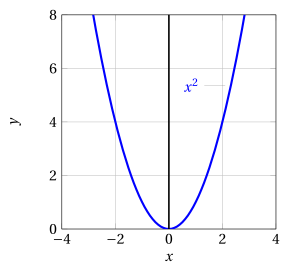
- Equivalently, we can say that a function is bounded above (bounded below, bounded) if, respectively, its image is a subset of \(\mathbb{R}\) that is bounded above (bounded below, bounded).
3. Symmetric functions
Definition 3: even function
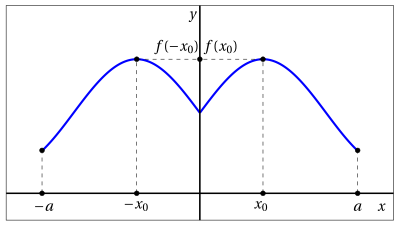
Functions whose graph is symmetric with respect to the \(y\)-axis are called even.
-
They are characterized by the relation
\[ f(-x) = f(x) \]which expresses the equality of the ordinates corresponding to the points \(x\) and \(-x\), which are symmetric with respect to \(x = 0\).
Definition 4: Odd function
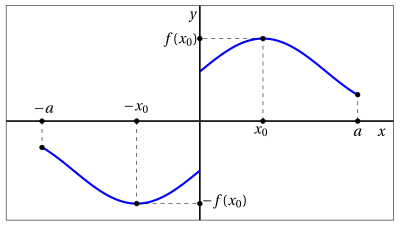
Functions whose graph is symmetric with respect to the origin are called odd.
-
They are characterized by the relation
\[ f(-x) = - f(x) \]which expresses the fact that the ordinates corresponding to the points \(x\) and \(-x\), which are symmetric with respect to \(x = 0\), are the opposite of each other.
Example 5: Even and odd functions
For example, the function \(x \mapsto x^2\) is even, while \(x \mapsto x^3\) is odd. More generally, powers with integer exponent are even functions if the exponent is even and odd functions if the exponent is odd.
-
Example of the graph of an even function:
-
Example of the graph of an odd function:
A function cannot have a graph that is symmetric with respect to the \(x\)-axis, since the correspondence would no longer be single-valued.
4. Monotonic functions
Definition 5: Increasing function
A function is called non-decreasing if for every pair of points \(x_1\), \(x_2\) in the domain of \(f\) we have:
Definition 6: Strictly increasing function
A function is called increasing if for every pair of points \(x_1\), \(x_2\) in the domain of \(f\) we have:
Definition 7: Decreasing function
A function is called non-increasing if for every pair of points \(x_1\), \(x_2\) in the domain of \(f\) we have:
Definition 8: Strictly decreasing function
A function is called decreasing if for every pair of points \(x_1\), \(x_2\) in the domain of \(f\) we have:
-
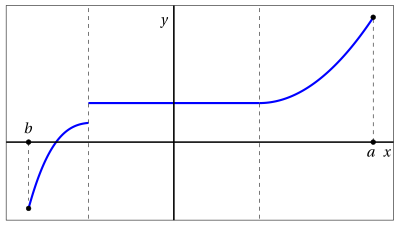
A function \(f\) is non-decreasing if, as \(x\) increases, the corresponding ordinate on the graph of the function does not decrease (hence it either stays the same or increases);
-
A function \(f\) is non-increasing if, as \(x\) increases, the corresponding ordinate on the graph of the function does not increase (hence it either stays the same or decreases).
Increasing or decreasing functions are called monotonic. Strictly increasing or strictly decreasing functions are called strictly monotonic.
Example 6: Monotonic functions
For example, the function \(x \mapsto x^3\) is strictly monotonic increasing; the constant function \(x \mapsto k\) (whose graph is the line with equation \(y = k\)) is both non-decreasing and non-increasing.
-
Example of the graph of a non-decreasing function (horizontal segment):
-
Example of the graph of an increasing function:
-
Increasing or decreasing functions (strictly or not) are called monotonic.
5. Periodic functions
Definition 9: Periodic function
A (non-constant) function \(f:D \rightarrow \mathbb{R}\) is periodic with period \(T\) , \(T > 0\), if \(T\) is the smallest positive real number such that
- Every interval of length \(T\) contained in \(D\) is called a periodicity interval.
Example 7: Periodic functions
Typical examples of periodic functions are the trigonometric functions \(x \mapsto \sin(x)\) (\(T=2\:\pi\)), \(x \mapsto \cos(x)\) (\(T=2\:\pi\)) and \(x \mapsto \tan(x)\) (\(T=\pi\)).
Example 8: Graph of periodic functions
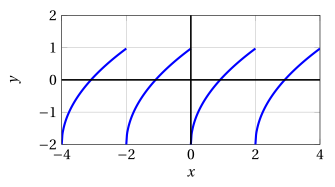
Graph of a periodic function with period \(T=2\):
-
Lines parallel to the \(x\)-axis have equation
\[ y = k \qquad k \in \mathbb{R} \]
-
If the line did not intersect the graph, this would mean that no output corresponds to the input \(x\). If the line intersected the graph at more than one point, this would mean that several distinct outputs correspond to the input \(x\), and hence the function would no longer be single-valued. ↩