Curve sketching
Part 4 · Derivatives · Chapter 9 · lecture notes by Fabio Furini · Chapter PDF
1. Graphs of real functions of a real variable
- The infinitesimal and differential calculus developed so far allows us to tackle completely the problem of drawing the graph of a function \(f\), that is, to carry out curve sketching (function analysis).
The steps of curve sketching:
-
Determine the (maximal) domain of \(f\).
-
Compute the limits at the boundary of the domain. Determine any horizontal/vertical asymptotes and points of discontinuity. Study the sign of the function and the points where it vanishes (possible only for relatively simple functions).
-
If the function tends to \(\infty\) as \(x \rr \infty\), determine any oblique asymptotes.
-
Compute the derivative function \(f'\) at the points where it exists. Study the points where \(f\) is continuous but not differentiable and determine their nature (corner points, inflection points with vertical tangent or cusps). At corner points or at the endpoints of the domain it is useful to compute the right or left derivatives, which determine the slope of the graph at those points.
-
Study the sign of \(f'\) (on its domain) to obtain information on the monotonicity of \(f\) and on its relative maximum and minimum points. Then determine the absolute maximum and minimum points.
Additional information:
-
It can be useful to determine an asymptotic estimate at infinity that tells us whether the function tends to \(\infty\) in a superlinear or sublinear way or in a linear way (in which case it may have an oblique asymptote). The asymptotic estimate at infinity normally also gives information on the concavity of \(f\) at infinity.
-
Compute the second derivative function \(f''\) and study its sign, to deduce information on the concavity and the inflection points of \(f\).
-
Determine any symmetry of \(f\) (even or odd functions) and restrict the study to \(x \ge 0\).
-
Determine any periodicity of \(f\) (periodic functions) and restrict the study to one period.
2. Examples
Example 1: Function analysis and graph
Let us study the function and draw its graph:
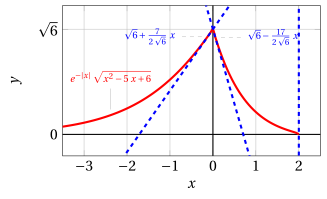
We expect a corner point at \(x=0\) due to the presence of \(|x|\), and points with vertical tangent where the radicand vanishes.
Step 1. The (maximal) domain of \(f\) is:
Step 2. The limits at the boundary are:
Hence the line \(y=0\) is a horizontal asymptote as \(x \rr \pm \infty\) and there are no vertical asymptotes. In the domain there are no points of discontinuity. We have \(f(x) \ge 0\) for every \(x\) in the domain and \(f(x)=0\) for \(x=2\) and \(x=3\).
Step 3. The function has no oblique asymptotes.
Step 4. We compute the derivative function for \(x \neq 0\):
Or, equivalently:
Example 2: Function analysis and graph
We compute the right and left derivatives at \(x=0\):
hence \(x=0\) is a corner point, that is, \(f'(0)\) does not exist. We compute the right-hand limit at \(x=3\) and the left-hand limit at \(x=2\) of the derivative function:
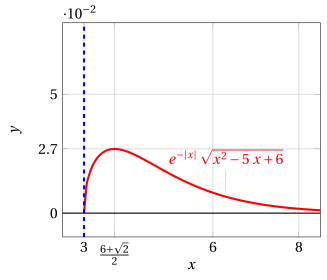
Hence the function has points with vertical tangent at \(x=2\) and \(x=3\).
Step 5. We study the sign of the derivative function:
-
For \(x>0\) we have:
\[ f'(x) \ge 0 {\rm ~~~~if~~~~} 2\;x^2-12\;x+17 \le 0, {\rm ~~~~that~is~~~~} x \in \left[\underbrace{\frac{6-\sqrt{2}}{2}}_{\approx 2.3}, \underbrace{\frac{6+\sqrt{2}}{2}}_{\approx 3.7} \right] \]hence:
\[ f {\rm ~~is~decreasing~for~~} x \in [0,2] \cup \left[\frac{6+\sqrt{2}}{2},\ip \right], ~~~~~ f {\rm ~~is~increasing~for~~} x \in \left[3,\frac{6+\sqrt{2}}{2} \right] \]We have \(f'\left(\frac{6+\sqrt{2}}{2}\right) =0\), hence \(x=\frac{6+\sqrt{2}}{2}\) is a relative maximum point. The relative maximum is \(f\left(\frac{6+\sqrt{2}}{2}\right) \approx 0.027\)
-
For \(x<0\) we have:
\[ f'(x) \ge 0 {\rm ~~~~if~~~~} 2\;x^2-8\;x+7 \ge 0, {\rm ~~~~that~is,~if~~~} x \in \left[\im,\frac{4-\sqrt{2}}{2}\right] \cup \left[\frac{4+\sqrt{2}}{2},\ip\right] \]hence \(f(x)\) is increasing for \(x<0\).
We can deduce that \(x = 0\) (where \(f\) is not differentiable) is an absolute maximum point; the absolute maximum is \(\sqrt{6} \approx 2.44\).
There are also two inflection points, one in \((0, 2)\) and one in \(( 3, \ip)\), which can be obtained by studying the sign of the second derivative.
Example 3: Function analysis and graph
Example 4: Function analysis and graph
Let us study the function and draw its graph:
Step 1. The (maximal) domain of \(f\) is:
Step 2. The limits at the boundary are:
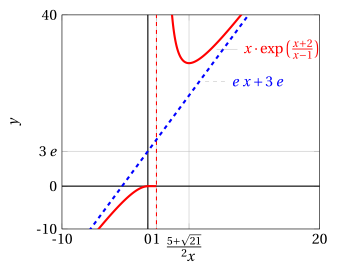
Hence there are no horizontal asymptotes and \(x=1\) is a point of discontinuity. Moreover, \(x=1\) is a vertical asymptote as \(x \rr 1^+\). We have \(f(x) \ge 0\) for \(x \ge 0\) and \(f(x)=0\) for \(x=0\).
Step 3. We compute an asymptotic estimate; we have:
hence
We therefore check for the presence of oblique asymptotes. We try to compute the following limit:
We have
therefore
consequently:
Hence the function has the oblique asymptote \(y = e\;x +3\;e~\) as \(x \rr \pm \infty\).
Example 5: Function analysis and graph
Step 4. We compute the derivative function for \(x \neq 1\):
For every \(x\neq 1\), \(f'\) is defined. We compute the left-hand limit at \(x=1\):
the exponential goes to zero faster than \((x - 1)^2\); hence the graph reaches \(x = 1\) with a horizontal tangent, from the left.
Step 5. We study the sign of the derivative function:
hence \(x=\frac{5+\sqrt{21}}{2}\) is a relative minimum point and \(x=\frac{5-\sqrt{21}}{2}\) is a relative maximum point.
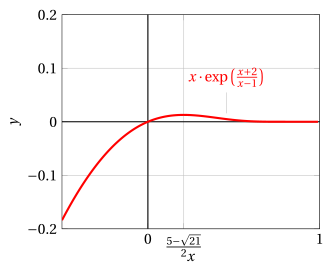
There is an inflection point in \(\left(\frac{5-\sqrt{21}}{2}, 1\right)\), which can be obtained by studying the sign of the second derivative.
Example 6: Function analysis and graph
We have \(f'_-(1)=0\) since:
with the change of variable \(y=\frac{x+2}{x-1}\): if \(x \rr 1^-\) then \(y \rr \im\); moreover:
hence we have:
with a second change of variable \(z=-y\): if \(y \rr \im\) then \(z \rr \ip\) and we have
by the theorem on the hierarchy of infinities.